All posts by Karen Blakeman

I have worked in the information profession for over twenty years and have been a freelance consultant since 1989. My company (RBA Information Services) provides training and consultancy on the use of the Internet, and on accessing and managing information resources. Prior to setting up RBA I worked at the Colindale Central Public Health Laboratory, and then spent ten years in the Pharmaceutical and Health Care industry before moving to the International management consultancy group Strategic Planning Associates. I edit and publish an electronic newsletter called Tales from the Terminal Room. Other publications include Search Strategies for the Internet. I am a Fellow of CILIP: The Chartered Institute of Library and Information Professionals, an active member of the UK eInformation Group (UKeiG) and a member of the Association of Independent Information Professionals (AIIP)

Workshop: Advanced Internet Search Strategies – London

A quick update on this full day workshop that is taking place in London on Wednesday, 18th February.  I can confirm that the workshop is indeed going ahead, barring a repeat of the Arctic blizzards we recently suffered! If you have not yet received confirmation of your booking (some letters appear to have gone astray) or would like to book a place please contact me at karen.blakeman@rba.co.uk .

Further details about the event and a booking form can be found at http://www.rba.co.uk/training/searching.htm

Are your savings safe?: Full guide to protect your cash

This page on MoneySavingExpert. com provides information on the protection offered by the FSCS (Financial Services Compensation Scheme) for UK savers. It outlines what type of savings and investments are covered by the scheme, should your bank or building society collapse. If you are in the fortunate position of having saved more than £50,000 – the maximum amount you would receive under the FSCS should your bank go bust –  then you ought to  think about spreading your investments across more than one financial institution.

There have been so many mergers in the UK banking sector that it is easy to lose track of who owns whom. To add to the confusion, two banks may have merged but still be registered as separate institutions under the FSA.  A table shows you which banks are standalone and which are part of the same institution. Any banks shaded in the same colour (except white) are linked and share protection. If you have money in a combination of linked banks you only receive one lot of the FSCS £50,000 safeguard. For example, if you have £40,000 in Birmingham Midshires and £30,000 in the Bank of Scotland you would only receive £50,000. In contrast NatWest and the Royal Bank of Scotland are at present registered as seperate institutions under the FSA and treated accordingly by the FSCS. If both went under and you had £40,000 in one and £30,000 in the other you would receive £70,000 under the FSCS.

There is basic information on European owned UK banks such as ING Direct, which are treated differently, and links to relevant pages on the FSA and FSCS web sites.

EIA – World Oil Price Timeline

The EIA World Oil Price Timeline is an annotated graph of the price of Saudi Light from 1970-1973 and Imported Refiner Acquisition Cost (IRAC) from 1974 to present. The blue line on the graph is the nominal price in US dollars per barrel and the red is the inflation adjusted price in January 2009 dollars. You can scroll along the time line to select a time period to view in more detail.

The letters on the graph refer to major events affecting the oil industry and  short summaries of  these are listed to the right. There are no links to the full articles and no information about the source of individual stories. There is, though, a list of the sources that are used at the bottom of the page and these include Energy Information Administration, Financial Times, International Oil Daily, Lloyd’s List and Reuters.

This is a neat tool that enables you to not only view the changing price of oil over the years but also to identify the events associated with those changes. As an example, take a look at the period 1975-1985 when the the oil price rose dramatically  in real terms.

Pageflakes RIP?

Pageflakes may be up again but there are questions about its long term viability. Phil Bradley’s blog posting Pageflakes is dead, or is it? may encourage you to think of moving your start page elsewhere. I moved UKeiG’s Pageflakes ‘stuff’ to Netvibes after the advertisement fiasco (see UKeiG Pageflakes content has moved to Netvibes).  As well as the lack of advance notice of adding adverts to pages – later withdrawn after many vociferous protests –  there had been technical problems, slow page loading,  and repeated down time.  We felt that we could no longer trust  Pageflakes nor could we  depend on them to provide a reliable service.

At the very least I would recommend that you document your Pageflakes content. In the longer term, consider moving to Netvibes or a similar service. Phil Bradley has a list of start pages at http://philbradley.typepad.com/i_want_to/create_a_personalised_start_page/

Keeping up with #uksnow disruption

If  you are interested in monitoring how the snow is progressing across the UK Ben Marsh has compiled a Google-Twitter mashup to map tweets tagged with #uksnow. Twitter users have been using #uksnow for reports on the amount of snowfall and travel disruption that they encounter. If they also include the first part of their postcode and marks out of 10 for the amount of snowfall their tweet is automatically added to a Google map.  The site updates every minute.

#uksnow tweets 9.55 am 2nd February 2009

Russia: All Regions Trade & Investment Guide 3rd Edition

Now in its 3rd edition this guide from CTEC Publishing LLC  is a comprehensive compilation of data for all 83 regions of Russia.

The guide includes:

  • An introduction by the head of each regional administration
  • Economic maps of the regions, brief general information, full contact details for each regional administration including the names and telephone numbers of relevant officials
  • Labour resources, growth dynamics and GRP structure by sectors, regional budgets and biggest banks, current situation and forecasts for industrial production by major sectors, fuel /energy balances, transport infrastructure, agribusiness, natural resources, products, structure and geography for exports and imports.
  • Each region’s demand for investment is presented indicating: capital investment dynamics, including foreign investment; major companies, including those with foreign participation, investment friendly sectors; data on regional privileges and advantages available to investors.

The Guide publishes data on 1000 real investment projects supported by regional administrations.

Further information, sample pages and an order form are available at  http://www.dataresources.co.uk/contents/en-uk/d7.html .  For a limited time the price has been reduced by 20%.

The full price with the 20% discount is  £316.  It is also possible to purchase individual PDF file covering each of the regions at http://www.russiasregions.com/

Mashups – tasty recipes for 2009!

I am giving a presentation on mashups to the Berks, Bucks & Oxon District branch of CILIP on Tuesday 3rd February, 18.00 for 18.30. Details are as follows:

Venue: Great Expectations, 33 London Street, Reading, Berkshire RG1 4PS http://www.streetmap.co.uk/newmap.srf?x=471801&y=173139&z=0&ar=Y .

Refreshments provided afterwards.

Mashups are not just for the remnants of your Christmas or Sunday dinner! A mashup is also a web application that combines data from more than one source into a single integrated tool, and you may be surprised at how commonplace they have become. Blogs, Yahoo Finance, Facebook, Geograph, and the latest UK police forces’ crime statistics all use mashups.

Karen Blakeman will look at examples from a variety of sectors and subject areas and show how easy it is to create your own. The issues of quality and ownership of data will also be addressed.

BBOD meetings are free and open to all with a professional interest in the topic.

If you plan to attend, please advise Norman Briggs, BBOD Events Co-Ordinator Tel: 0118 987 1115,  nwbriggs@pcintell.co..uk or Chrissy Allott, BBOD Chair Chrissy.Allott@berkshire.nhs.uk

New home page for Yahoo! UK & Ireland

… and it is GHASTLY!

It is Monday morning and on my of list of things-to-do when I fire up my laptop is to check My Yahoo! This is where I monitor stocks and shares, news headlines, weather forecasts and have tools such as currency conversion. Before going to My Yahoo I always go to the main Yahoo! UK & Ireland page to view the national and international headlines and see what’s new. This morning was a real shock. The home page has changed dramatically and not for the good.

Yahoo UK & Ireland new home page

Apart from the hideous colours and layout there is no direct link to My Yahoo any more. It is now under ‘All Yahoo Services’ (in very small type on the right hand side). The ‘My Apps’ on the left are definitely not My Yahoo apart from the weather forecast and the stock trader. The latter clearly does not work in this context as it tells me that today my stocks and shares are up GBP 270,165.49 and that my portfolios are worth 2,907,437.49. In my dreams! I am not interested in horoscopes, mailboxes, videos and eBay but there does not seem to be any way of getting rid of them.

Thankfully search.yahoo.co.uk is still plain vanilla. I have now bookmarked My Yahoo and won’t bother in future with the Yahoo home page. I am now wondering what Yahoo has in store for us next.

Search and the UK’s regional press

If you are a serious news junkie like myself, you may find Martin Belam’s recent series of articles on the UK’s regional press of interest. The articles cover topics such as the provision of RSS (not all newspapers offer them!), links to social bookmarking sites, and the site search options offered by the newspapers. This is all very useful information for anyone who needs to assess the quality and functionality of local press sites in terms of current content, archives and alerting services.

Online maps for local crime statistics

Police forces in England and Wales are now providing access to local crime statistics via online maps. These allow the public to drill down to ward level and view crime trends in their area. The statistics include information about burglary, robbery, theft, vehicle crime, violent crime and anti-social behaviour.

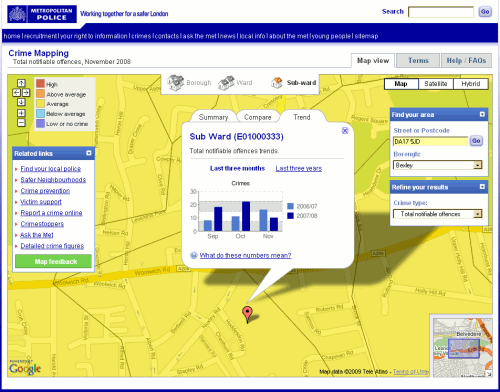
The maps should be available via the local police web sites, although you may have to hunt around for the links. Once you have found the maps, you can either browse them or enter your post code to find information on just your area. The interfaces and presentation of the data can vary considerably between police forces as does the break-down of the crime statistics. Thames Valley provides a basic map and tables of data, while others such as the Metropolitan police offer graphs as well as the figures. All of the online maps colour code areas according to the levels of crime: high, above average, average, below average, low or no crime.

Metropolitan Police crime statistics for postcode DA17 5JD

Metropolitan Police statistics for postcode DA17 5JD