Tag Archives: energy

Interactive maps of UK renewable energy generation

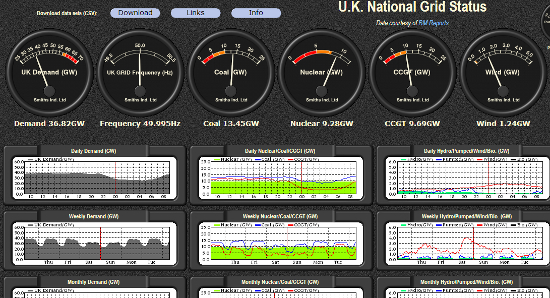
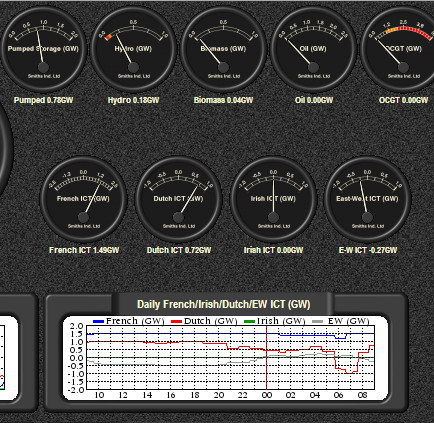
I recently mentioned Gridwatch (How the UK’s electricity is generated  http://www.rba.co.uk/wordpress/2013/08/21/how-the-uks-electricity-is-generated/) as a way of tracking how much energy is passing through the National Grid and the technology used to generate that electricity. Although Gridwatch is a great way of observing the total amount of electricity that is generated by each technology – gas, coal, wind etc – it does not go into any detail with respect to individual installations. The Digest of UK energy statistics (DUKES) produced by the UK  Department of Energy & Climate Change (http://www.gov.uk/government/organisations/department-of-energy-climate-change/series/digest-of-uk-energy-statistics-dukes) includes a spreadsheet listing all of the operational power stations, fuel that they use, installed capacity, location, and the year that generation began. The direct link to the spreadsheet is http://www.gov.uk/government/uploads/system/uploads/attachment_data/file/226895/dukes5_11.xls. This is historical data and the current list refers to plants in operation at the end of May 2013.

UK Energy Watch has a map (http://www.ukenergywatch.org/Electricity/PowerStations) showing the location of UK power stations of 400 MW or larger, so it is by no means comprehensive. It does allow you, though, to click on a plant and display current generation except for CCGT stations (Combined Cycle Gas Turbine).

There are more options available when it comes to what are called renewables (for example wind, solar, biomass, hydro). The DECC’s RESTATS interactive map at http://restats.decc.gov.uk/app/pub/map/map/ enables you to search by technology, region, county, planning authority and application status. It also has a separate map for wind farm capacities.

RESTATS Interactive Map of Renewables

The site information includes installed capacity, details of the planning application but not how much energy is actually being produced. RESTATS says that “Information is held on the performance of operational projects but owing to the need to maintain the commercially sensitive nature of these data, specific site details and performance figures are not disclosed“.

RestatsSIteDetails


The UK Data explorer has produced a renewables map at http://ukdataexplorer.com/renewables/ that uses the RESTATS data and shows operational renewable electricity sites over 0.01 MW. The different colours represent the type of plant and the area of the circles indicate installed capacity (maximum power output).

UK Data Explorer renewables interactive map


To see details of a specific installation you should be able to hover over a point on the map. This did not work for me with some of the smaller plants and when I tried to zoom in on an area I often lost the background map.

The Interactive Map of Renewable and Alternative Energy Projects in the UK at http://www.renewables-map.co.uk is another interactive map and can be filtered by technology type and planning status.


Renewables Map UK


According to the website the information is gathered from “a wide range of web resources, in all cases these will be referenced, usually by a link to that information. Locations are either taken from existing data, usually from planning applications, or by painstakingly identifying the location on the ground using online maps.” I am not sure how up to date the map is and I noticed that the smaller hydro installations along the Thames are missing. Another problem that I have experienced with this site is that when I click on “More details” for an installation I get far too many “internal sever errors”. However, when the information does appear it includes useful comments on the technology, links to relevant websites and the latest news.


Renewables_Map2

The final one in my list is from the energy generating company RWE Innogy (http://www.rwe.com/web/cms/en/194914/rwe-innogy/sites/production-data-live/). Its interactive map provides information on most of its European plants and includes wind farms, hydro power plants and biomass CHP (Combined Heat and Power). The production data is updated every minute. To see information on an installation, click on its icon on the map. The information includes live production, location, type of installation and when production started.

 Renewables_RWE

These are by no means the only websites offering interactive maps and information on UK energy production, and none of them give the full picture. They are good starting points, though, if you are interested in researching individual technologies or individual power stations.

How the UK’s electricity is generated

Gas and electricity supply, and energy in general, are constantly in the headlines in the UK. Reports on the anti-fracking protests at Balcombe recently dominated discussions on the topic but the central issue remains. How do we meet our energy needs in the future: gas, coal, nuclear, renewables? Looking at the level of current consumption and how it is generated is key to understanding the nature of the problem. For electricity, there is detailed data available on the status of the UK National Grid and can now be viewed via a service called Gridwatch.

Gridwatch (http://www.gridwatch.templar.co.uk/index.php) shows the demand for electricity in the UK at any one time, the source and how it is being generated. The site is maintained by Templar Consultancy and uses near real-time data from BM Reports on what the UK’s electricity grid is doing. The data is updated every 5 minutes.

The data is presented as a series of dials so that you can easily see how much energy is generated and how that changes throughout the day. Most of the screen is taken up with dials for demand, coal, nuclear, CCGT (gas) and wind.

 Gridwatch - UK National Grid Status

The right hand area of the screen shows how much electricity is generated through pumped hydro, hydro, biomass and oil, and the level of imported electricity.

 UK National Grid Status Imports

  UK National Grid Status - Gas

Move your cursor over a dial for further information on the different technologies and sources of generation. Coal and nuclear power stations are always switched on and provide most of what is called the base load of electricity required throughout the day. Gas makes up the difference and covers peak demand and balances the variable output from renewables such as wind.

Not much changes during the summer months but the demand can increase dramatically during very cold weather in the winter. It is interesting to see how the dials shift as soon as people get up in the morning. Also, the amount of electricity produced via wind turbines drops to almost zero during stormy weather. The turbines are switched off in high winds to protect them from damage.

Warning: this site can be addictive, especially if you start monitoring it during late autumn and winter!

For more data and statistics on UK energy go to the Department of Energy and Climate Change (DECC) at https://www.gov.uk/government/organisations/department-of-energy-climate-change/about/statistics

IFEG Advanced Search, Statistics & Market Research

I have now uploaded the slides for my workshop at the Information for Energy Group (IFEG). As usual, I have uploaded them to several different web sites in case one or more are blocked by corporate firewalls. If you have problems accessing any of the locations, let me know and I’ll sort out some other means of getting the presentation to you.

Workshop: Advanced Internet Searching for Energy Information & Market Research
Organised for:
Information for Energy Group
Venue: The Energy Institute, New Cavendish Street, London.
Date: Thursday 13 May 2010

PowerPoint Presentation (download from the RBA site – 7.5 MB)
authorSTREAM
Slideboom
Slideshare

EIA – World Oil Price Timeline

The EIA World Oil Price Timeline is an annotated graph of the price of Saudi Light from 1970-1973 and Imported Refiner Acquisition Cost (IRAC) from 1974 to present. The blue line on the graph is the nominal price in US dollars per barrel and the red is the inflation adjusted price in January 2009 dollars. You can scroll along the time line to select a time period to view in more detail.

The letters on the graph refer to major events affecting the oil industry and  short summaries of  these are listed to the right. There are no links to the full articles and no information about the source of individual stories. There is, though, a list of the sources that are used at the bottom of the page and these include Energy Information Administration, Financial Times, International Oil Daily, Lloyd’s List and Reuters.

This is a neat tool that enables you to not only view the changing price of oil over the years but also to identify the events associated with those changes. As an example, take a look at the period 1975-1985 when the the oil price rose dramatically  in real terms.

Simmons & Company – energy statistics and data

Simmons & Company International is the only independent investment bank specializing in the energy industry. Founded in 1974, the firm has acted as financial advisor in over $134 billion of transactions, including 535 merger and acquisitions worth over $93 billion. As well as copies of presentations made by senior partner Matthew R Simmons there is a collection of industry statistics gathered from a variety of sources. These are split into upstream and downstream and include rig counts, summaries of oil and gas prices, US crude oil inventories, refining capacity and days of supply. There is some International data but much of it is North American biased.

Under the main Energy Industry link are lists of major public listed upstream and downstream companies (coverage is world-wide), and links to industry news sources, associations, statistics and government sites (many are North American).

Despite the geographical bias, this is a good starting point for information on the oil and gas industry as it lists most of the key resources.  Matthew Simmons’s presentations and papers are often quoted in the main stream media and are worth monitoring. There is an email alert for new presentations but no RSS. If you are desperate for RSS rather than email  there is always the Page2RSS service that monitors pages for changes and alerts you via RSS.

Renewable Fuels Agency (RFA)

The Renewable Fuels Agency (RFA) (http://www.dft.gov.uk/rfa/) has been set up by the UK Government to implement the Renewable Transport Fuel Obligation (RTFO) (http://www.dft.gov.uk/rfa/aboutthertfo.cfm), which came into force on 1st April 2008. The RTFO obliges fossil fuel suppliers to ensure that by 2010 biofuels account for 5% by volume of the fuel supplied on UK forecourts. The purpose of the RTFO is to “reduce the UK’s contribution to climate change and its reliance on fossil fuels”. The RFA publishes updates on the progress of the RTFO. These include monthly reports on progress on achieving compliance with sustainability criteria and quarterly reports to the Department for Transport and annual reports to parliament. All reports are available on the web site.

With serious questions being raised about the impact of biofuels on food prices, farming and the environment in general, it will be interesting to see how long this all carries on.  The RFA’s first monthly report has just been published and covers the period 15th April – 14th May 2008. The press release contains some good summary statistics for those of us who need to get hold of such data in a hurry. There are ‘associated files’ (PDF and an Excel spreadsheet) that contain more detailed information.

The UK Coal Authority

The UK Coal Authority (http://www.coal.gov.uk) aims “to facilitate the proper exploitation of the Nation’s coal resources, whilst providing information and addressing liabilities for which the Authority is responsible, in a professional, efficient and open manner”.

If you own or are purchasing a property in a coal mining area there is a search service that will check whether or not the property might be affected by past or existing mining activity.  The gazetteer (under Information Services) gives an indication of places in Great Britain that may, or may not, require a mining search to be performed.  If you are thinking of moving within the UK it would be as well to check this site as well as the Environment Agency’s ‘In Your Backyard‘ (http://www.environment-agency.gov.uk/maps/), which tells you if the area is at risk of flood and whether there’s a landfill site near your house.

The Coal Authority site also has reports on mining activity in the UK and statistics on production. There are links to sites that cover coal mining related topics and information on technologies. The latter includes coal gasification,  cleaner coal technologies and environmental issues. These technology ‘fact sheets’ are a good starting point if you need to get up to speed on the industry jargon and how it all works.

Energy Export Databrowser

The Energy Export Databrowser, set up Jonathan Callahan, is based on BP’s 2007 Statistical Review and provides a quick and easy way to view country data on consumption, import and export of crude oil and natural gas. It covers over 80 countries and data goes back to the 1960s. There is feedback on the browser itself and an interesting discussion on the accuracy and validity of the underlying data on The Oildrum.

Directories: Major Companies of the World 2008

Seven new Editions of the World’s Major Companies Series have been published by Graham & Whiteside and are now available for purchase on the dataresources web site.

Major Chemical and Petrochemical Companies of the World 2008
This directory covers more than 7,000 of the leading chemical and petrochemical companies worldwide.

Major Energy Companies of the World 2008
More than 4,000 companies involved in coal mining and coal products; electricity supply; fuel distribution; natural gas supply; nuclear engineering; oil and gas exploration and production; oil and gas services and equipment; and oil refining worldwide.

Major Financial Institutions of the World 2008 (2 Vols)
Over 9,000 leading financial institutions worldwide, including banks, investment, insurance and leasing companies.

Major Food and Drink Companies of the World 2008
9,800 of the leading food, alcoholic and non-alcoholic drink companies worldwide.

Major Information Technology Companies of the World 2008
This directory covers more than 3,100 of the leading information technology companies worldwide.

Major Pharmaceutical and Biotechnology Companies of the World 2008
The world’s largest pharmaceutical companies, providing essential business profiles of the international leaders in the industry.

Major Telecommunications Companies of the World 2008
Profiles of more than 3,500 of the leading telecommunications companies worldwide, including many of the top Internet companies.