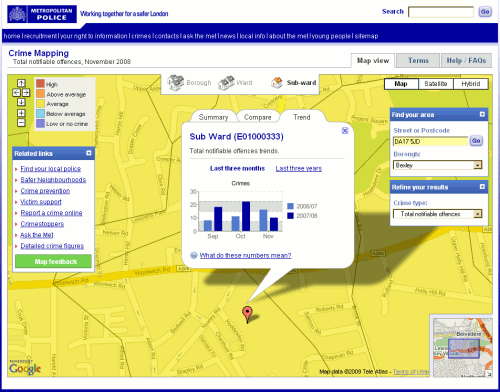
Police forces in England and Wales are now providing access to local crime statistics via online maps. These allow the public to drill down to ward level and view crime trends in their area. The statistics include information about burglary, robbery, theft, vehicle crime, violent crime and anti-social behaviour.
The maps should be available via the local police web sites, although you may have to hunt around for the links. Once you have found the maps, you can either browse them or enter your post code to find information on just your area. The interfaces and presentation of the data can vary considerably between police forces as does the break-down of the crime statistics. Thames Valley provides a basic map and tables of data, while others such as the Metropolitan police offer graphs as well as the figures. All of the online maps colour code areas according to the levels of crime: high, above average, average, below average, low or no crime.
Metropolitan Police crime statistics for postcode DA17 5JD

…more links would be helpful, thanks.
Sorry, Oranjepan. I was so overjoyed to finally find some of the maps I forgot to put the links in.
The Metropolitan Police online crime maps are at http://maps.met.police.uk/. Thames Valley’s are at http://www.thamesvalley.police.uk/Instant-atlas/atlas.html .
For the other police forces web sites simply Google their name or go to https://www.askthe.police.uk/. Some have put links to the crime maps on their home page in a prominent place, others have buried them several layers down in the menus.