Tag Archives: Statistics

UK crime data as clear as mud

I’m a nosy neighbour. I like to know what’s going on in my area: who’s bought the house next door, local planning applications, any dodgy activity going on? My husband and I are both self employed so there is usually at least one of us out and about in Caversham during the day. That means we have the chance to chat with our local postman, workmen digging up the road, Police Community Support Officers doing their rounds and with people in the local shops, bank and post office. Crime, not surprisingly, is a major topic on our “watch list” and just over two years ago police forces in England and Wales started to provide access to local crime statistics via online maps. The new service allowed you to drill down to ward level and view trends in burglary, robbery, theft, vehicle crime, violent crime and anti-social behaviour.

The format varied from one police force to another. For example Thames Valley Police provided a basic map and tables of data:
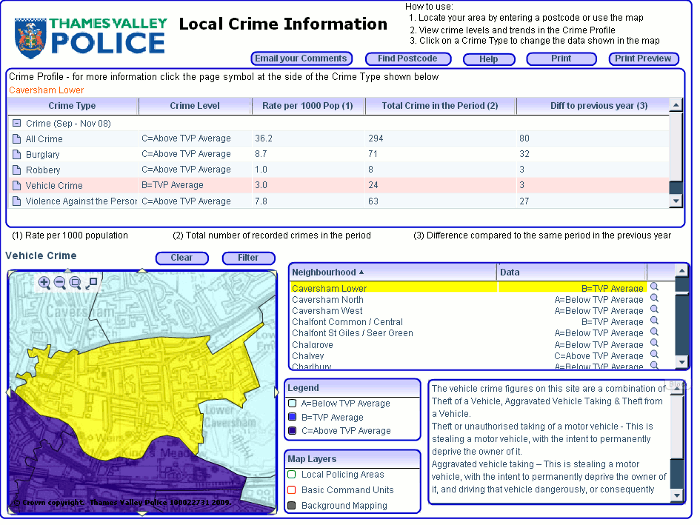
Thames Valley Police 2008 crime rates

Others such as the Metropolitan Police included additional graphical representation of the statistics such as  bar charts:
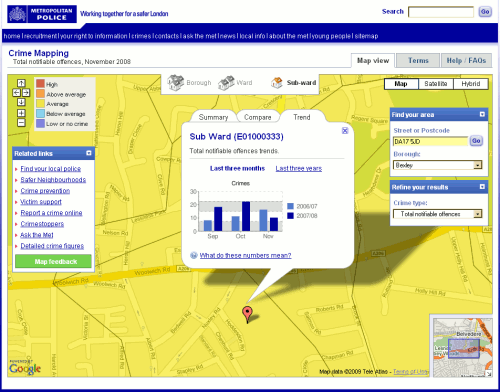
Metropolitan Police 2008 Crime Rates

None of them pinned down incidents to individual streets or addresses but they did give you an idea of the level of crime in a particular neighbourhood, how it compared with the same period the previous year and whether it was high, above average, average, below average, low or no crime. They were short, though, on detailed definitions of what each category of crime included. I looked at these maps out of personal curiosity rather than using them for any serious business application, and I made certain assumptions such as murder being included under ‘Violence against the person’. That may not have been the case.

Some police forces placed obvious links to the information on their home pages whilst others buried the data in obscure corners of their web sites. The crime maps where then all moved to the CrimeMapper web site – the Thames Valley Police map can still be seen at http://maps.police.uk/view/thames-valley – but that has now been integrated into Police.uk website, which “includes street-level crime data and many other enhancements“.

All you have to do is go to http://www.police.uk/, type in your postcode, town, village or street into the search box and “get instant access to street-level crime maps and data, as well as details of your local policing team and beat meetings“. The first screen looks good with news of local meetings, events, recent tweets, YouTube videos and – as the home page promised – information on my local policing team.
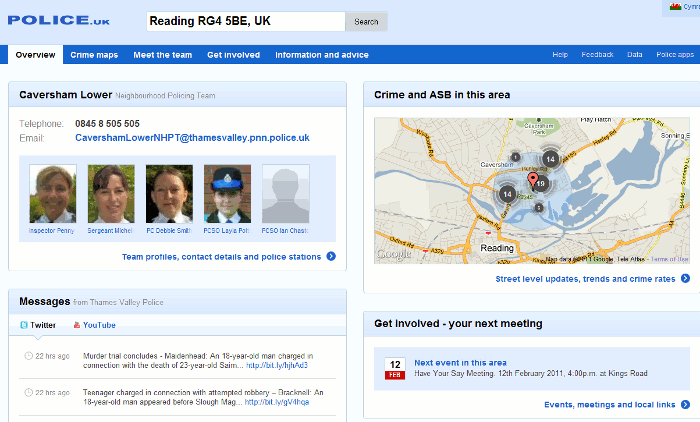
Police UK page for RG4 5BE

When I focus on the map to look at the detail there are markers for the location of the crimes and clicking on them gives you a brief description of the crime:
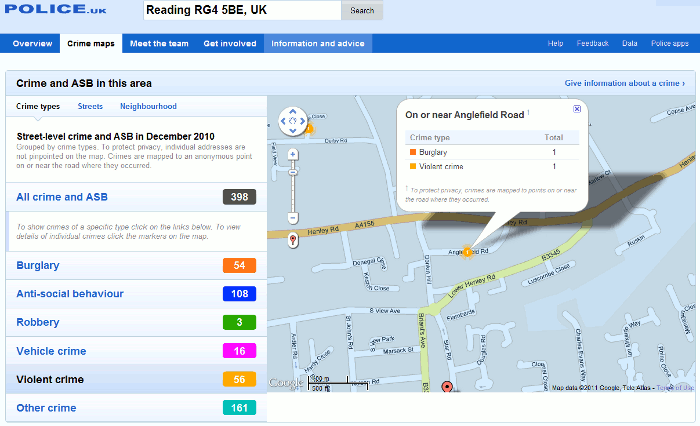
Detail on Police UK crime rates for Caversham

In this example, the detail box had details of two crimes “on or near Anglefield Road” and this is where I started to become confused. Were the burglary and the violent crime part  of the same incident or totally separate? Furthermore, if you look in the left hand panel of the screen you will see “To protect privacy, individual addresses are not pinpointed on the map. Crimes are mapped to an anonymous point on or near the road where they occurred.” Fair enough, but I would like to know how near ‘near’ is. 100, 200, 400 yards? Half a mile, a mile? And does the focus shift from one street to another from one month to the next? If it stays put then a street could gain a crime rate reputation that it does not deserve but if it shifts there is no way one can compare data from one month or year to another, which brings me to my next question.

Why is there only one month’s data? Previous versions of the crime maps gave you three months data for the current and the previous year for comparison. There is nothing about this in the Help section of  the Police UK site but the Guardian reports:

police forces have indicated that whenever a new set of data is uploaded – probably each month – the previous set will be removed from public view, making comparisons impossible unless outside developers actively store it.” (Crime maps are ‘worse than useless’, claim developers http://www.guardian.co.uk/technology/2011/feb/02/uk-crime-maps-developers-unhappy?CMP=twt_iph).

This means that if you want to run comparisons over time you will have to download the files and store them on your own system each month, or find someone else who is already doing it.

The Guardian article also says:

the Information Commissioner‘s Office (ICO) advised that tying crime reports to postcodes or streets with fewer than 12 addresses would render the individuals involved too identifiable. The police have also decided to remove data about murders or sexual assaults.

With respect to the latter the help file on the Police UK site suggests otherwise:

Crimes have been grouped into six categories following advice from the Information Commissioner’s Office. This doesn’t mean that the crimes listed under ‘other’ are not seen as important. Rather it ensures that for some of the more sensitive crimes there is even greater privacy for the victims.

So which is it: murders and sexual assaults are not included at all or aggregated under “other”? Jonathan Raper says on his blog Placr News (“Five reasons to be cautious about street level crime data” http://placr.co.uk/blog/2011/02/five-reasons-to-be-cautious-about-street-level-crime-data/):

Some data is redacted eg sexual offences, murder. The Metropolitan Police has already released this data to ward level though… and it is easy to cross-reference one murder in one ward to reports in the local press at the same time

Data visualisations and mashups are becoming increasingly popular and make it considerably easier to assess a situation and view trends. The Guardian Datablog (http://www.guardian.co.uk/news/datablog), for example, encourages people to take data sets, mash them up and create their own visualisations, and upload a screen shot to  the Guardian Datastore on Flickr (http://www.flickr.com/groups/1115946@N24/). It is vital, though, that the source of the data, whether the full data set or just a selection has been used, and whether or not it is going to be updated is clearly spelt out. All too often one or even all of these are missing from the accompanying notes, and in some cases there are no notes at all!

An example of good practice is “UK transport mapped: Every bus stop, train station, ferry port and taxi rank in Britain” (http://www.guardian.co.uk/news/datablog/2010/sep/27/uk-transport-national-public-data-repository). The posting clearly states the source (http://data.gov.uk/dataset/nptdr) and its coverage:

“A snapshot of every public transport journey in Great Britain for a selected week in October each year. The dataset is compiled with information from many sources, including local public transport information from each of the traveline regions, also coach services from the national coach services database and rail information from the Association of Train Operating Companies”

It then goes on to specify the time period  (5-11 October, 2009) and the tools that were used to create the visualisation.

Another is the “Live map of London Underground trains” (http://traintimes.org.uk/map/tube/). This shows “all trains on the London Underground network in approximately real time“. The source is a live data feed from Transport for London (TfL) and the notes state that a “small number of stations are misplaced or missing; occasional trains behave oddly; some H&C and Circle stations are missing in the TfL feed.” It would be helpful to have a list of those missing stations, but the site has at least brought the issue of potential missing data to the users’ attention.

Returning to the Police.uk crime data, there are three major problems with the site for me as a researcher:

1. Are all crimes included in the database, or are some such as murders and sexual assaults excluded altogether or aggregated under “other”? More detailed and unambiguous scope notes please.

2. The street data level is useless. The markers are not exact locations but “near” to, there is no definition of “near”, no information on how the position of the marker is calculated or the geographic radius that it covers. It would be better to return to aggregated data at the ward level.

3. There are no options for comparing time periods and it seems that historical data will not be available on the web site. An ad hoc researcher will have to spend time and effort tracking down a developer or a web site that is downloading and keeping copies of all of the datasets as they are published.

The new crime data web site is a retrograde step. We need transparency and clarity rather than the muddle and confusion that has been generated by the lack of information on what is being provided.
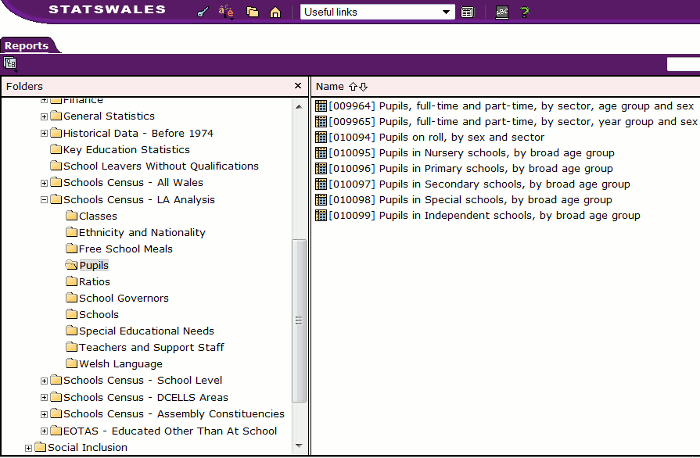
StatsWales: free statistics on Wales

When looking for UK official statistics many of us immediately think of http://www.statistics.gov.uk/. If you are looking for data on Wales, though, you really should be heading for the Welsh Assembly’s StatsWales at http://statswales.wales.gov.uk/. This is a free-to-use service that allows you to “view, manipulate, create and download tables from the most detailed official data on Wales”. You can run a keyword search on the data or simply browse the Reports folders.

StatsWales folders

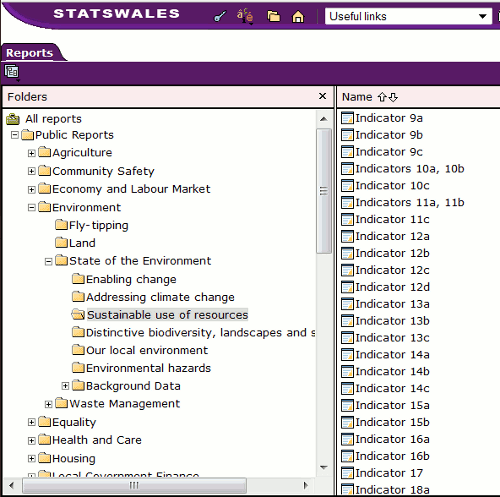
The built in search option may be your best bet (Note: Google ‘site:’ search does not work on this data collection). Most of the tables, charts and reports are clearly labelled but there are some sections where all you are told is that the data is “Indicator 9a” or “Indicator 12c”, for example.  It is only when you click on the file that you discover it’s contents.

StatsWales Folders

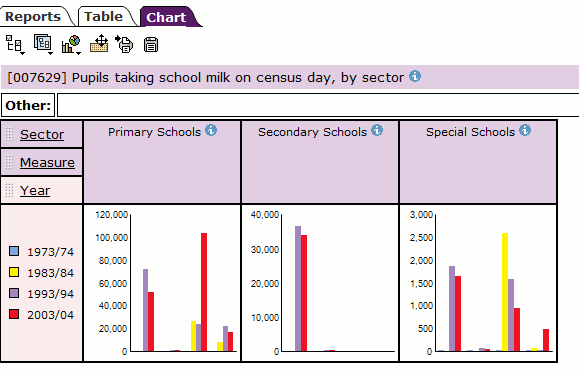
You can also select subsets of the data and produce your own tables and charts. If you register you can create your own profile, design and save your reports.

StatsWales Charts

There are many options for viewing and manipulating the data on the web site itself and it can seem overwhelming at times. You may prefer to just download the data sets and work on them offline, but if you think you might be a regular user of the this site it is worth working through the tutorials and getting to grips with the StatsWales tools. You can register for e-mail notifications of changes to specific datasets and RSS feeds are also available to alert you to new sets that have been added to the site.

Internet Statistics: BBC SuperPower – Visualising the internet

Looking for some interesting stats about the web? Then head straight for this section on the BBC web site (http://news.bbc.co.uk/1/hi/technology/8552415.stm), which is part of SuperPower, a season of programmes exploring the power of the internet. It provides a range of statistics including interactive graphics showing the most visited sites and types of site on the internet (as measured by Nielsen). The top 100 sites graphic breaks down into search/portals, social networks, retail sites, media/news and by country. Move your cursor over a block in the visualistaion and it will display the name of the site, number of unique visitors and percentage market share.

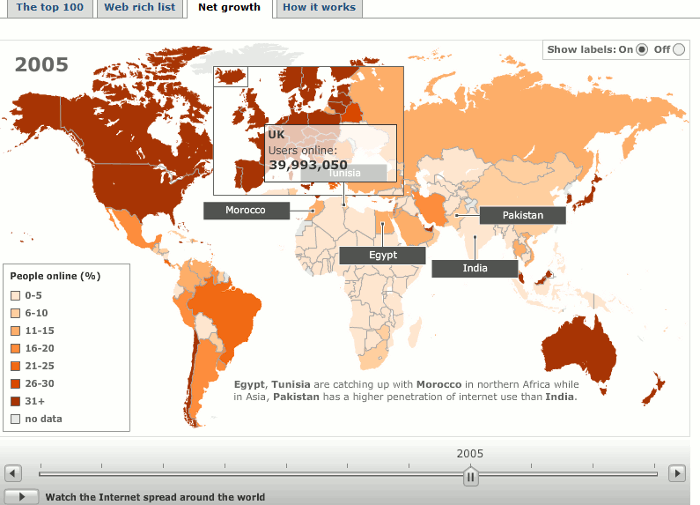
The Web Rich List holds no surprises with Larry Page and Sergey Brin at the top and both worth 17.5 billion USD. The Net Growth map has a slider bar underneath it that you can use to view internet usage over time. Set the slider bar at the year you are interested in, move your cursor over a country and it will tell you the number of users.

Growth of the Internet

‘How it Works’ has a very basic set of slides about how the Internet works but you might find the counters to the right of the slides more interesting. They claim to show the estimated number of internet users in the world, the number of email messages posted so far today (includes spam), the number of blog posts today, and the approximate number of Google searches today. An obvious number that is missing is the number of Tweets but you can find some statistics on Twitter’s own blog at Twitter Blog: Measuring Tweets http://blog.twitter.com/2010/02/measuring-tweets.html

Google Public Data Explorer- fine as far as it goes

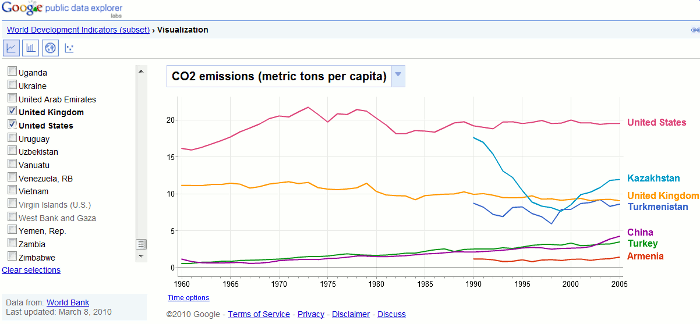
Currently a Google Labs project, the Public Data explorer (http://www.google.com/publicdata/home) “makes large datasets easy to explore, visualize and communicate. As the charts and maps animate over time, the changes in the world become easier to understand.” The example given on the home page is a chart showing data from the World Bank on fertility rates per woman by country and life expectancy at birth. At first glance you may be deterred by what appears to be limited datasets but there are options to explore by selecting countries, different data series and time options.

In the example below I looked at CO2 emissions per capita for selected countries:

Other data sets include the OECD Factbook, some Eurostat collections, and several US datasets. Details can be found at http://www.google.com/publicdata/directory.

How useful is Google’s data explorer to the serious researcher? It all depends on whether or not the dataset you require is available – and there are a limited number – and whether or not it covers the years you need. I noticed that some of the datasets had 2005 as the latest year. Although you can embed the “visualizations” in your own web pages there are currently no download options. It is worth familiarising yourself with what has been made available here and the different “visualisation options” are attractive, but you really can’t beat going direct to the original provider of the statistics. My own favourite starting point for tracking down data on a topic and/or country is still OFFSTATS – The University of Auckland Library at http://www.offstats.auckland.ac.nz/browse/

Workshop: Statistics and Market Research

If you need to track down statistics and market research via the web I am running a hands-on workshop under the UKeiG banner in Newcastle on Wednesday 21st April. The venue is the Netskills Training Suite, University of Newcastle. Further details of the workshop and a booking form are available on the UKeiG web site at http://www.ukeig.org.uk/training/2010/StatsApril.html

Switzerland in Figures

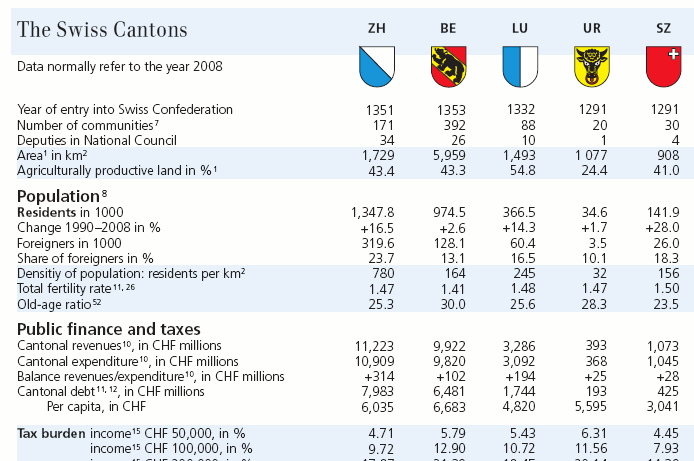
This is a very useful three page PDF summary of Swiss statistics from UBS. It contains more than 1,600 facts and figures on the Swiss economy and each of the cantons, and an international overview of key data. Data includes population, employment, the financial situation, indebtedness, tax levels, and figures on the economy and living standards. This is the 2009 edition.

UBS Switzerland in Figures

Thanks to Gary Price for the alert (http://www.resourceshelf.com/2010/01/10/switzerland-in-figures/)

Google compiles industry stats for the UK – sort of

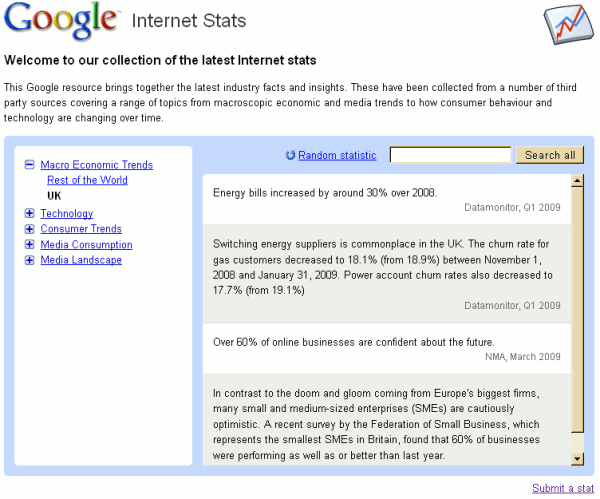
Google has launched a new page that pulls together industry stats for the UK. Google – Internet Stats, which is biased towards information on electronic and online services and products, gathers data from third party vendors many of which are priced. A list is available at the bottom of the Internet Stats page. You can, though, submit your own “killer fact”.  All submissions are vetted by Google.

There are five categories: Technology, Macro Economic Trends, Media Landscape, Media Consumption and  Consumer Trends. Each section has further sub-categories.

This is not the answer to a market/industry researcher’s prayer. The number of statistics is very limited and the search option only searches within the browsable statistics on the landing page. Do not expect to be able to search for and find data on, for example, UK chocolate consumption! If your query falls within one of the listed categories you may be in luck.

Exactly where Google is going with this and why they have introduced it is not clear. This is a UK-only initiative at present and there is no link to it from either the .com or .co.uk main Google search pages. Neither is it listed in Google Labs. Even the official announcement on “Google Barometer: New! Internet Stats all in one place” gives very little further information.

TriMark Publications – Biotechnology, Healthcare and Life Sciences Market Research

TriMark Publications focuses on market research in biotechnology, health care and the life sciences. You can browse reports or search by keyword. The market reports vary in price but there are detailed table of contents and the first three or four pages available free of charge as a sample. However, any figures or data on the pages are blacked out.  It is refreshing, though, to see a detailed listing of what is contained in the reports before you part with significant amounts of money.

Sector Snapshots cost just USD 500 and provide a high-level overview of a particular market sector, including key players, sales data and emerging trends.

Database Tables, costing USD 100 each, are a one-page table of hard-to-find numerical information. They are derived from “a proprietary source” and provide a high-level overview of specific data points in a table format. Database Tables are not reports or comprehensive analyses.

Simmons & Company – energy statistics and data

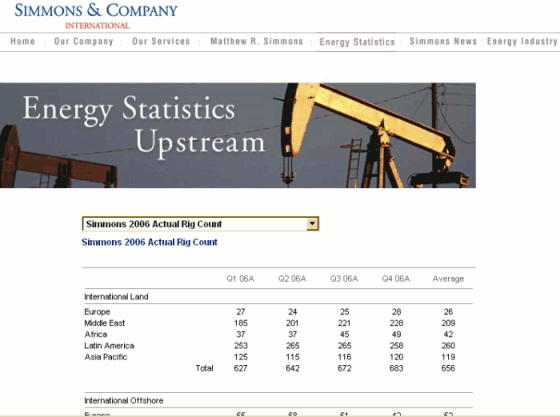
Simmons & Company International is the only independent investment bank specializing in the energy industry. Founded in 1974, the firm has acted as financial advisor in over $134 billion of transactions, including 535 merger and acquisitions worth over $93 billion. As well as copies of presentations made by senior partner Matthew R Simmons there is a collection of industry statistics gathered from a variety of sources. These are split into upstream and downstream and include rig counts, summaries of oil and gas prices, US crude oil inventories, refining capacity and days of supply. There is some International data but much of it is North American biased.

Under the main Energy Industry link are lists of major public listed upstream and downstream companies (coverage is world-wide), and links to industry news sources, associations, statistics and government sites (many are North American).

Despite the geographical bias, this is a good starting point for information on the oil and gas industry as it lists most of the key resources.  Matthew Simmons’s presentations and papers are often quoted in the main stream media and are worth monitoring. There is an email alert for new presentations but no RSS. If you are desperate for RSS rather than email  there is always the Page2RSS service that monitors pages for changes and alerts you via RSS.

Renewable Fuels Agency (RFA)

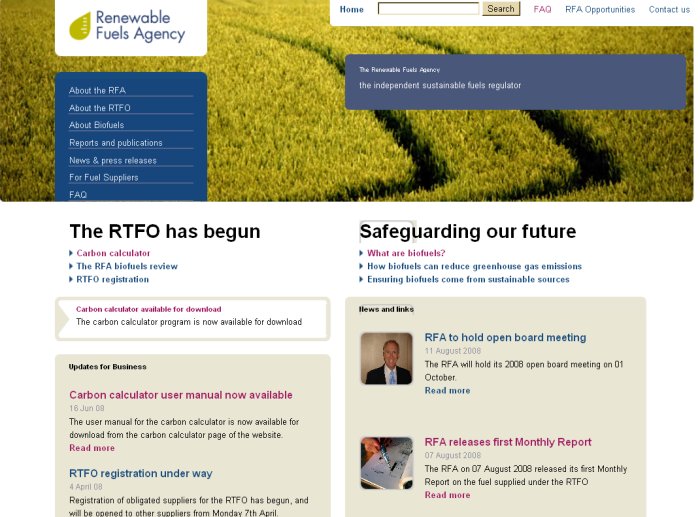
The Renewable Fuels Agency (RFA) (http://www.dft.gov.uk/rfa/) has been set up by the UK Government to implement the Renewable Transport Fuel Obligation (RTFO) (http://www.dft.gov.uk/rfa/aboutthertfo.cfm), which came into force on 1st April 2008. The RTFO obliges fossil fuel suppliers to ensure that by 2010 biofuels account for 5% by volume of the fuel supplied on UK forecourts. The purpose of the RTFO is to “reduce the UK’s contribution to climate change and its reliance on fossil fuels”. The RFA publishes updates on the progress of the RTFO. These include monthly reports on progress on achieving compliance with sustainability criteria and quarterly reports to the Department for Transport and annual reports to parliament. All reports are available on the web site.

With serious questions being raised about the impact of biofuels on food prices, farming and the environment in general, it will be interesting to see how long this all carries on.  The RFA’s first monthly report has just been published and covers the period 15th April – 14th May 2008. The press release contains some good summary statistics for those of us who need to get hold of such data in a hurry. There are ‘associated files’ (PDF and an Excel spreadsheet) that contain more detailed information.